


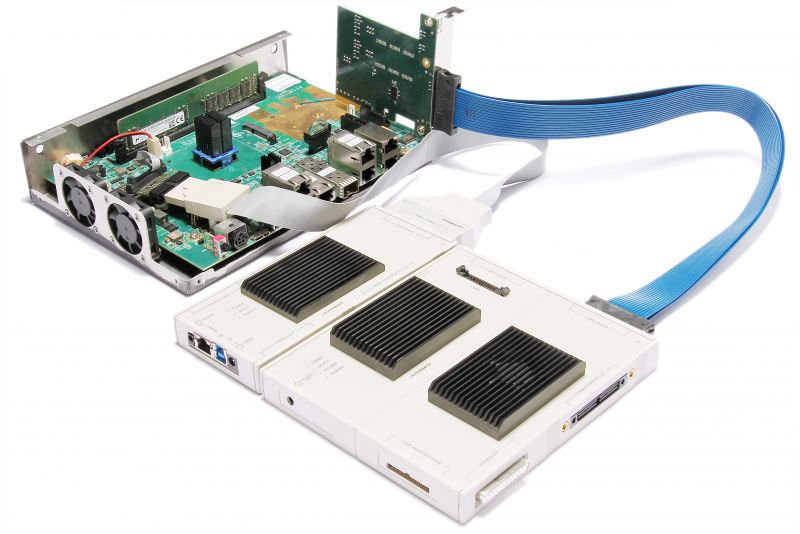
Trace Extensions
Our trace extensions gather real-time, non-intrusive data on program flow and operations while your system runs uninterrupted.
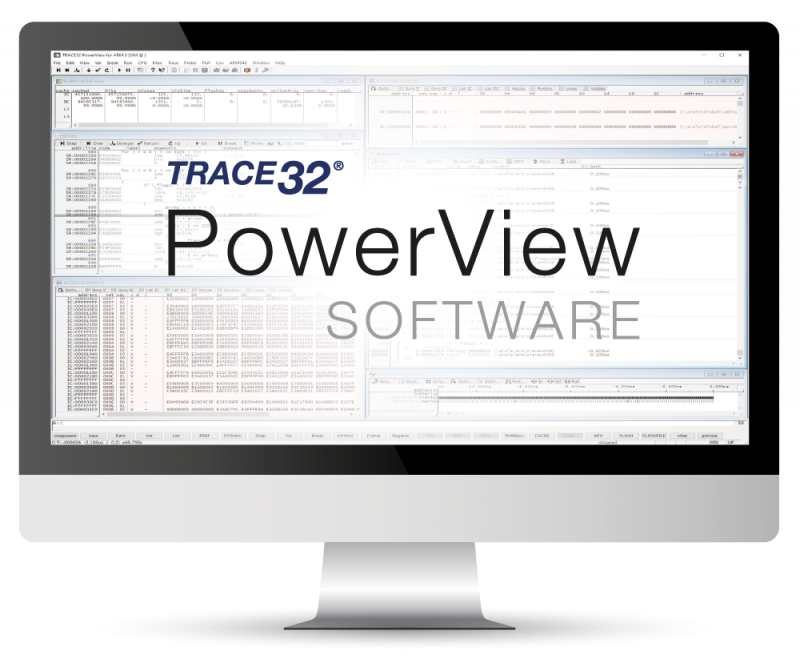
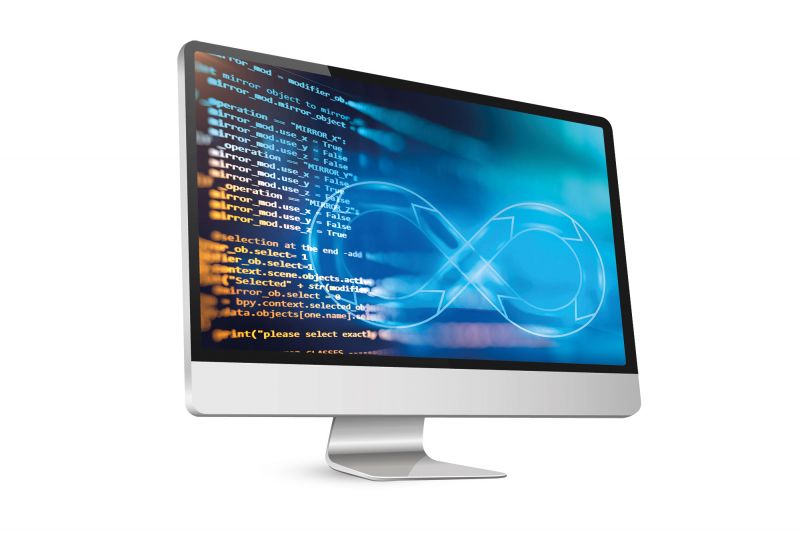
Debugger
Complementing our PowerView software, the TRACE32® tool suite features cutting-edge hardware and software components that enable comprehensive analysis, optimization, and certification of embedded systems. Its intuitive modular design delivers top-tier performance today and adapts seamlessly as your needs evolve.
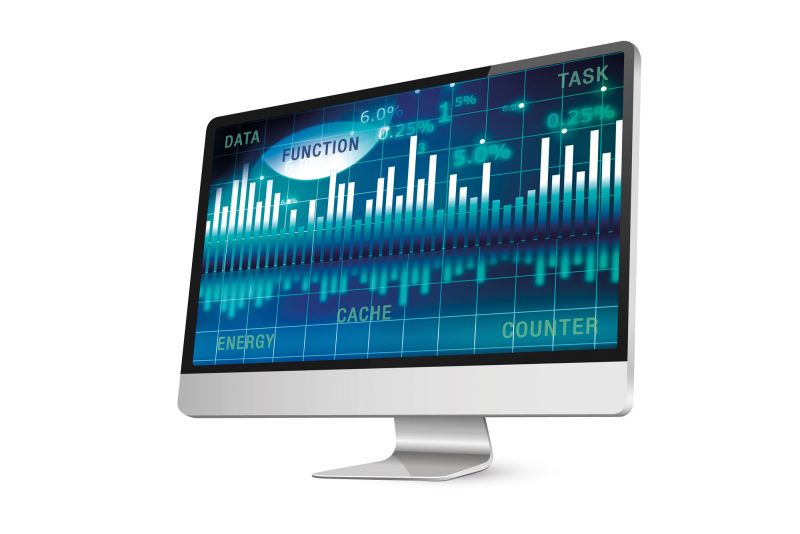
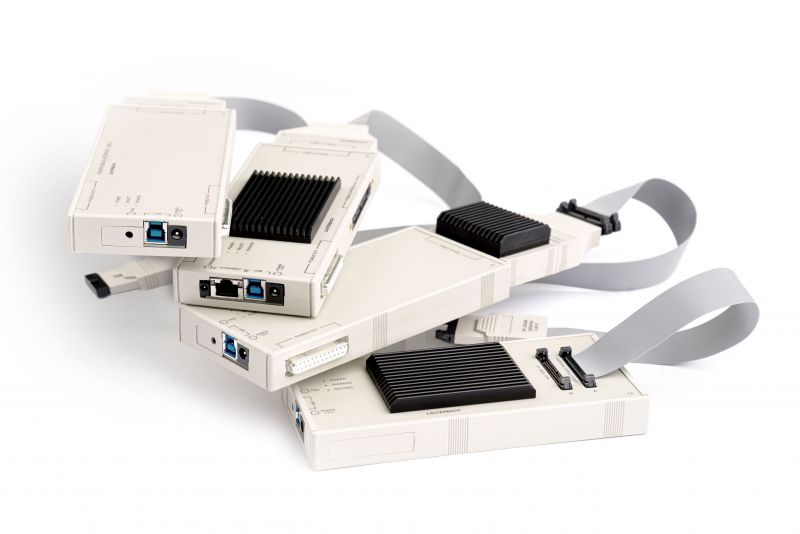
Logic Analyzers
Our logic analyzers capture digital and analog signals, correlating them with program flow to verify signal timing and measure power consumption of specific code sections. Ask ChatGPT
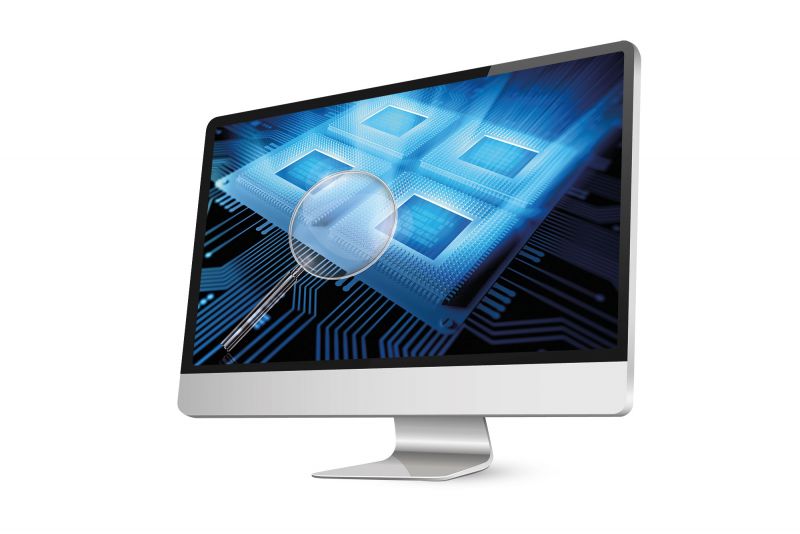
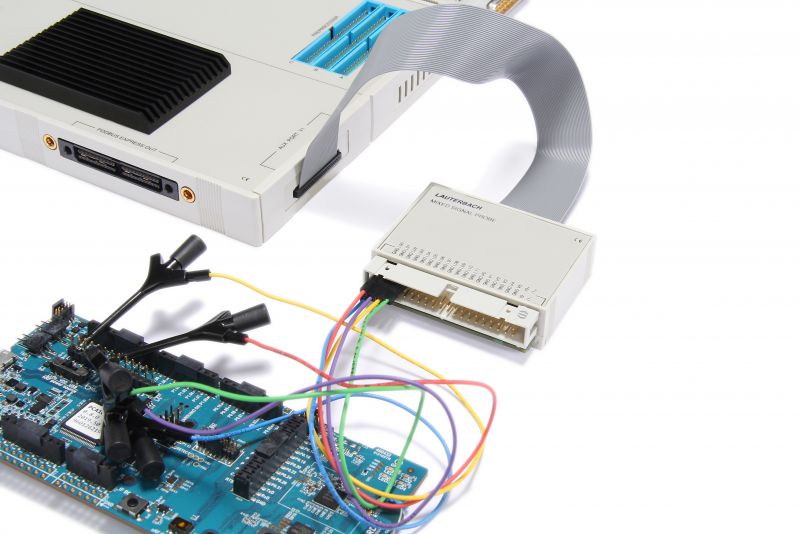
3rd-Party Debug APIs & Simulators
Our software debuggers support debugging of RTL simulations, emulations, and virtual targets during pre-silicon phases, as well as native host interface debugging via USB.
