Overview
Flexible and Scalable Debugging for Any Embedded Project
PowerDebug by Lauterbach is a modular and high-performance debugging platform, designed to evolve with your development needs. Whether you're switching between microcontrollers or working across multiple embedded projects, PowerDebug offers unmatched flexibility and wide-ranging support for the industry's most common chip architectures.
Begin with a universal PowerDebug base unit and pair it with a debug probe tailored to your target. Expand your capabilities by adding trace and logic analyzer modules to enable real-time analysis, code coverage insights, and advanced system diagnostics.
BENEFITS
Maximize the Value of Your Debugging Infrastructure
Scale Your Debug Setup as You Grow
Lauterbach’s modular architecture lets you expand easily—support for new processors is just a software update, license addition, or debug probe away. Start with the essentials and add advanced capabilities over time, ensuring your debug solution evolves with your projects and technology roadmap.
Tackle the Most Challenging Debugging Scenarios
With TRACE32® PowerView, Lauterbach delivers a powerful and intuitive debug environment designed for complex embedded systems. Supporting advanced multi-core debugging, hypervisor analysis, and OS-aware insights, this fully scriptable toolkit gives you the precision and control needed to solve even the most demanding development challenges.
Achieve Top Debugging Performance
Lauterbach’s smart debug modules deliver industry-leading download speeds and ultra-low latency, enabling fast, efficient debugging and seamless test automation. Designed for high-performance embedded development, these tools help you streamline workflows and reduce time-to-market.
Streamline Your Workflow with a Unified Interface
TRACE32® PowerView offers a consistent and intuitive graphical user interface that simplifies debugging across different CPU architectures. Its unified design helps reduce learning curves, speeds up development, and ensures a smoother transition between projects and platforms.
Rely on Long-Term Support and Future Compatibility
With Lauterbach, your investment is built to last. Enjoy continuous software updates that add new features and CPU support—even for older debug modules. Combined with reliable hardware repair services, you can count on your system to deliver value and performance for years to come.
COMPONENTS
Discover the Core Components of Your Debug Solution
The TRACE32 PowerDebug System is built on a modular architecture designed for flexibility and scalability. At its core is the PowerDebug module, offering a universal, target-independent interface to your host PC via USB 3.0 or Gigabit Ethernet. Paired with a platform-specific debug probe, it creates a complete and adaptable debug environment tailored to your embedded development needs.
PowerDebug Modules
A High-Performance Foundation for Debugging Virtually Any Chip
Lauterbach’s PowerDebug modules act as powerful on-target debug accelerators. By placing processing close to the hardware, they dramatically reduce latency, boost upload/download speeds, and shift key debugging tasks away from the host PC. This hardware-assisted approach delivers significantly faster performance than traditional host-based systems—helping you cut development time and reduce project costs.
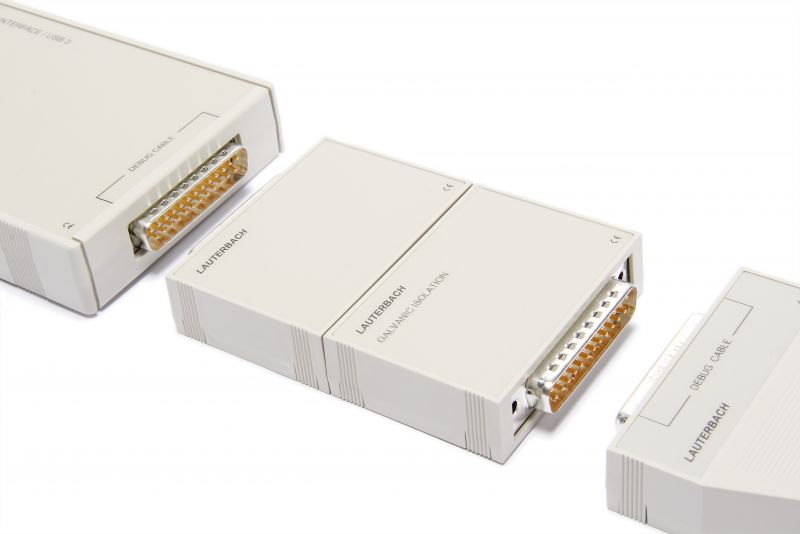
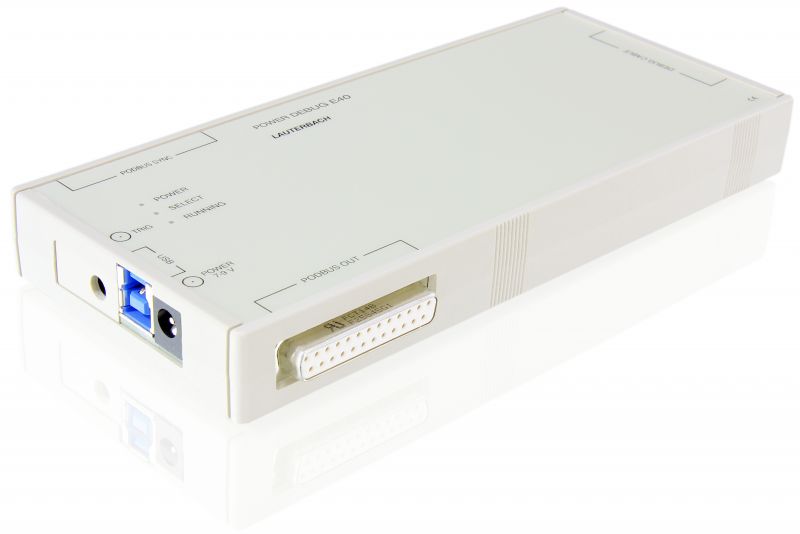
PowerDebug E40 – Reliable Debug Controller for Every Task
The PowerDebug E40 is a robust essential-line debug controller that delivers the performance you need to efficiently handle both simple and complex debugging challenges. Designed for versatility, it provides a solid foundation for your embedded development workflow.
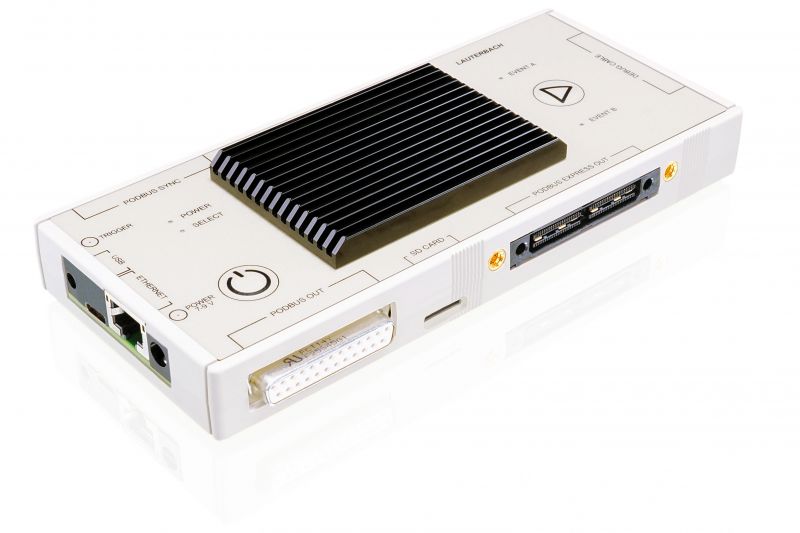
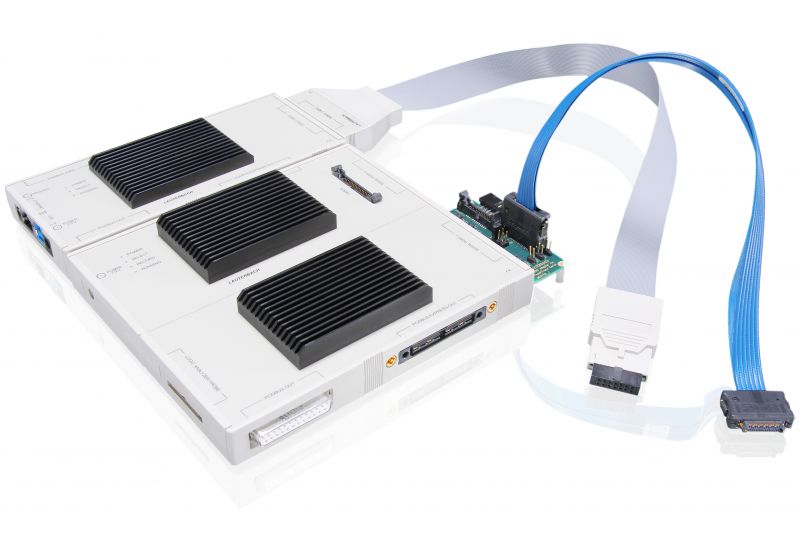
PowerDebug X51 – High-Speed, Scalable Debug Controller
The PowerDebug X51 is a next-generation, high-performance debug controller built for flexibility and longevity. Its modular design supports seamless expansion with off-chip trace modules, making it a future-proof solution for demanding embedded development environments.
DEBUG PROBES
High-Integrity Target Connection with Platform-Specific Debug Probes
Between your target device and the PowerDebug module sits a dedicated debug probe designed to ensure optimal signal quality. Tailored to the specific debug interface—including voltage levels, signal types, supported protocols, and physical form factors—this active circuitry is positioned as close as possible to the target processor to maximize signal integrity.
Each debug probe comes licensed for the corresponding processor architecture, and for SoCs with multiple cores, probes can support concurrent debugging across several architectures through additional licenses.
Since development boards and final hardware often use different mechanical connectors, a wide selection of adapters and converters is available to seamlessly connect the debug probe to your unit under test.
The advanced CombiProbe combines dual debug and trace ports, supporting 4-bit trace ports for detailed system or compact flow tracing. It also enables connection to a Mixed Signal Probe for comprehensive digital and analog signal analysis.
AUTO26 Debug Probe
The AUTO26 debug probe is purpose-built to meet the stringent requirements of automotive projects, providing reliable and precise debugging capabilities optimized for automotive microcontrollers and systems.
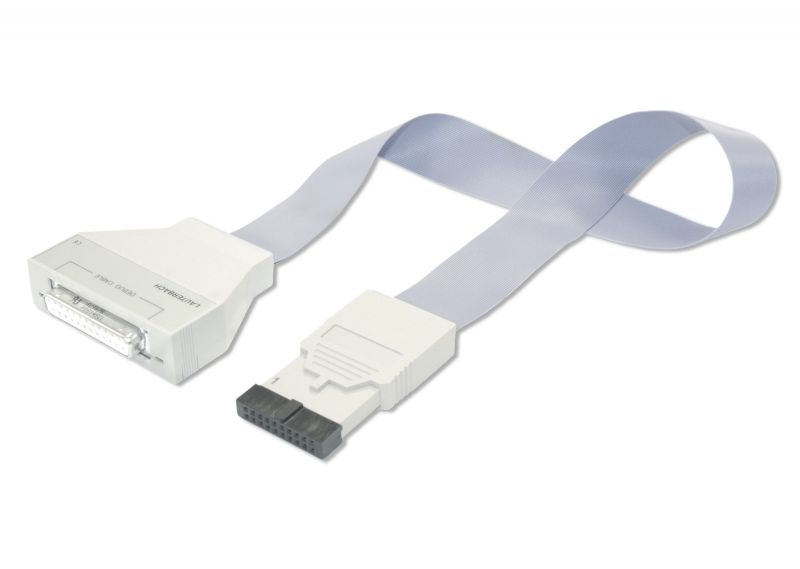
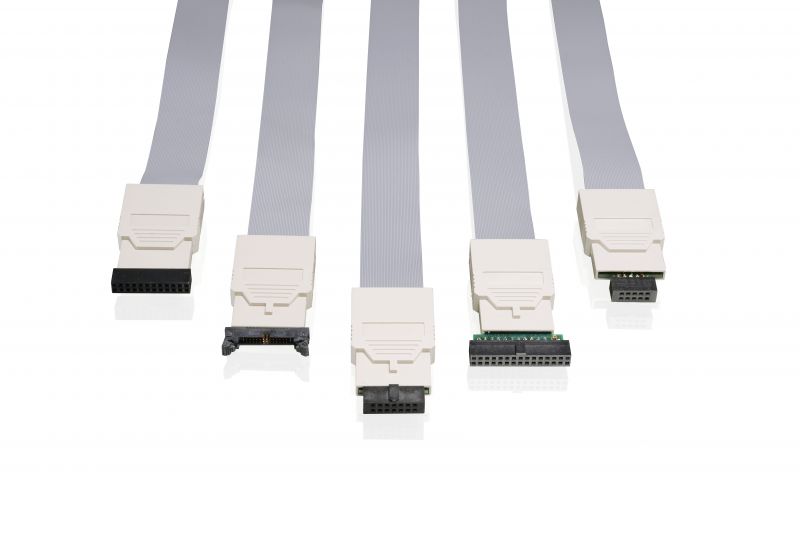
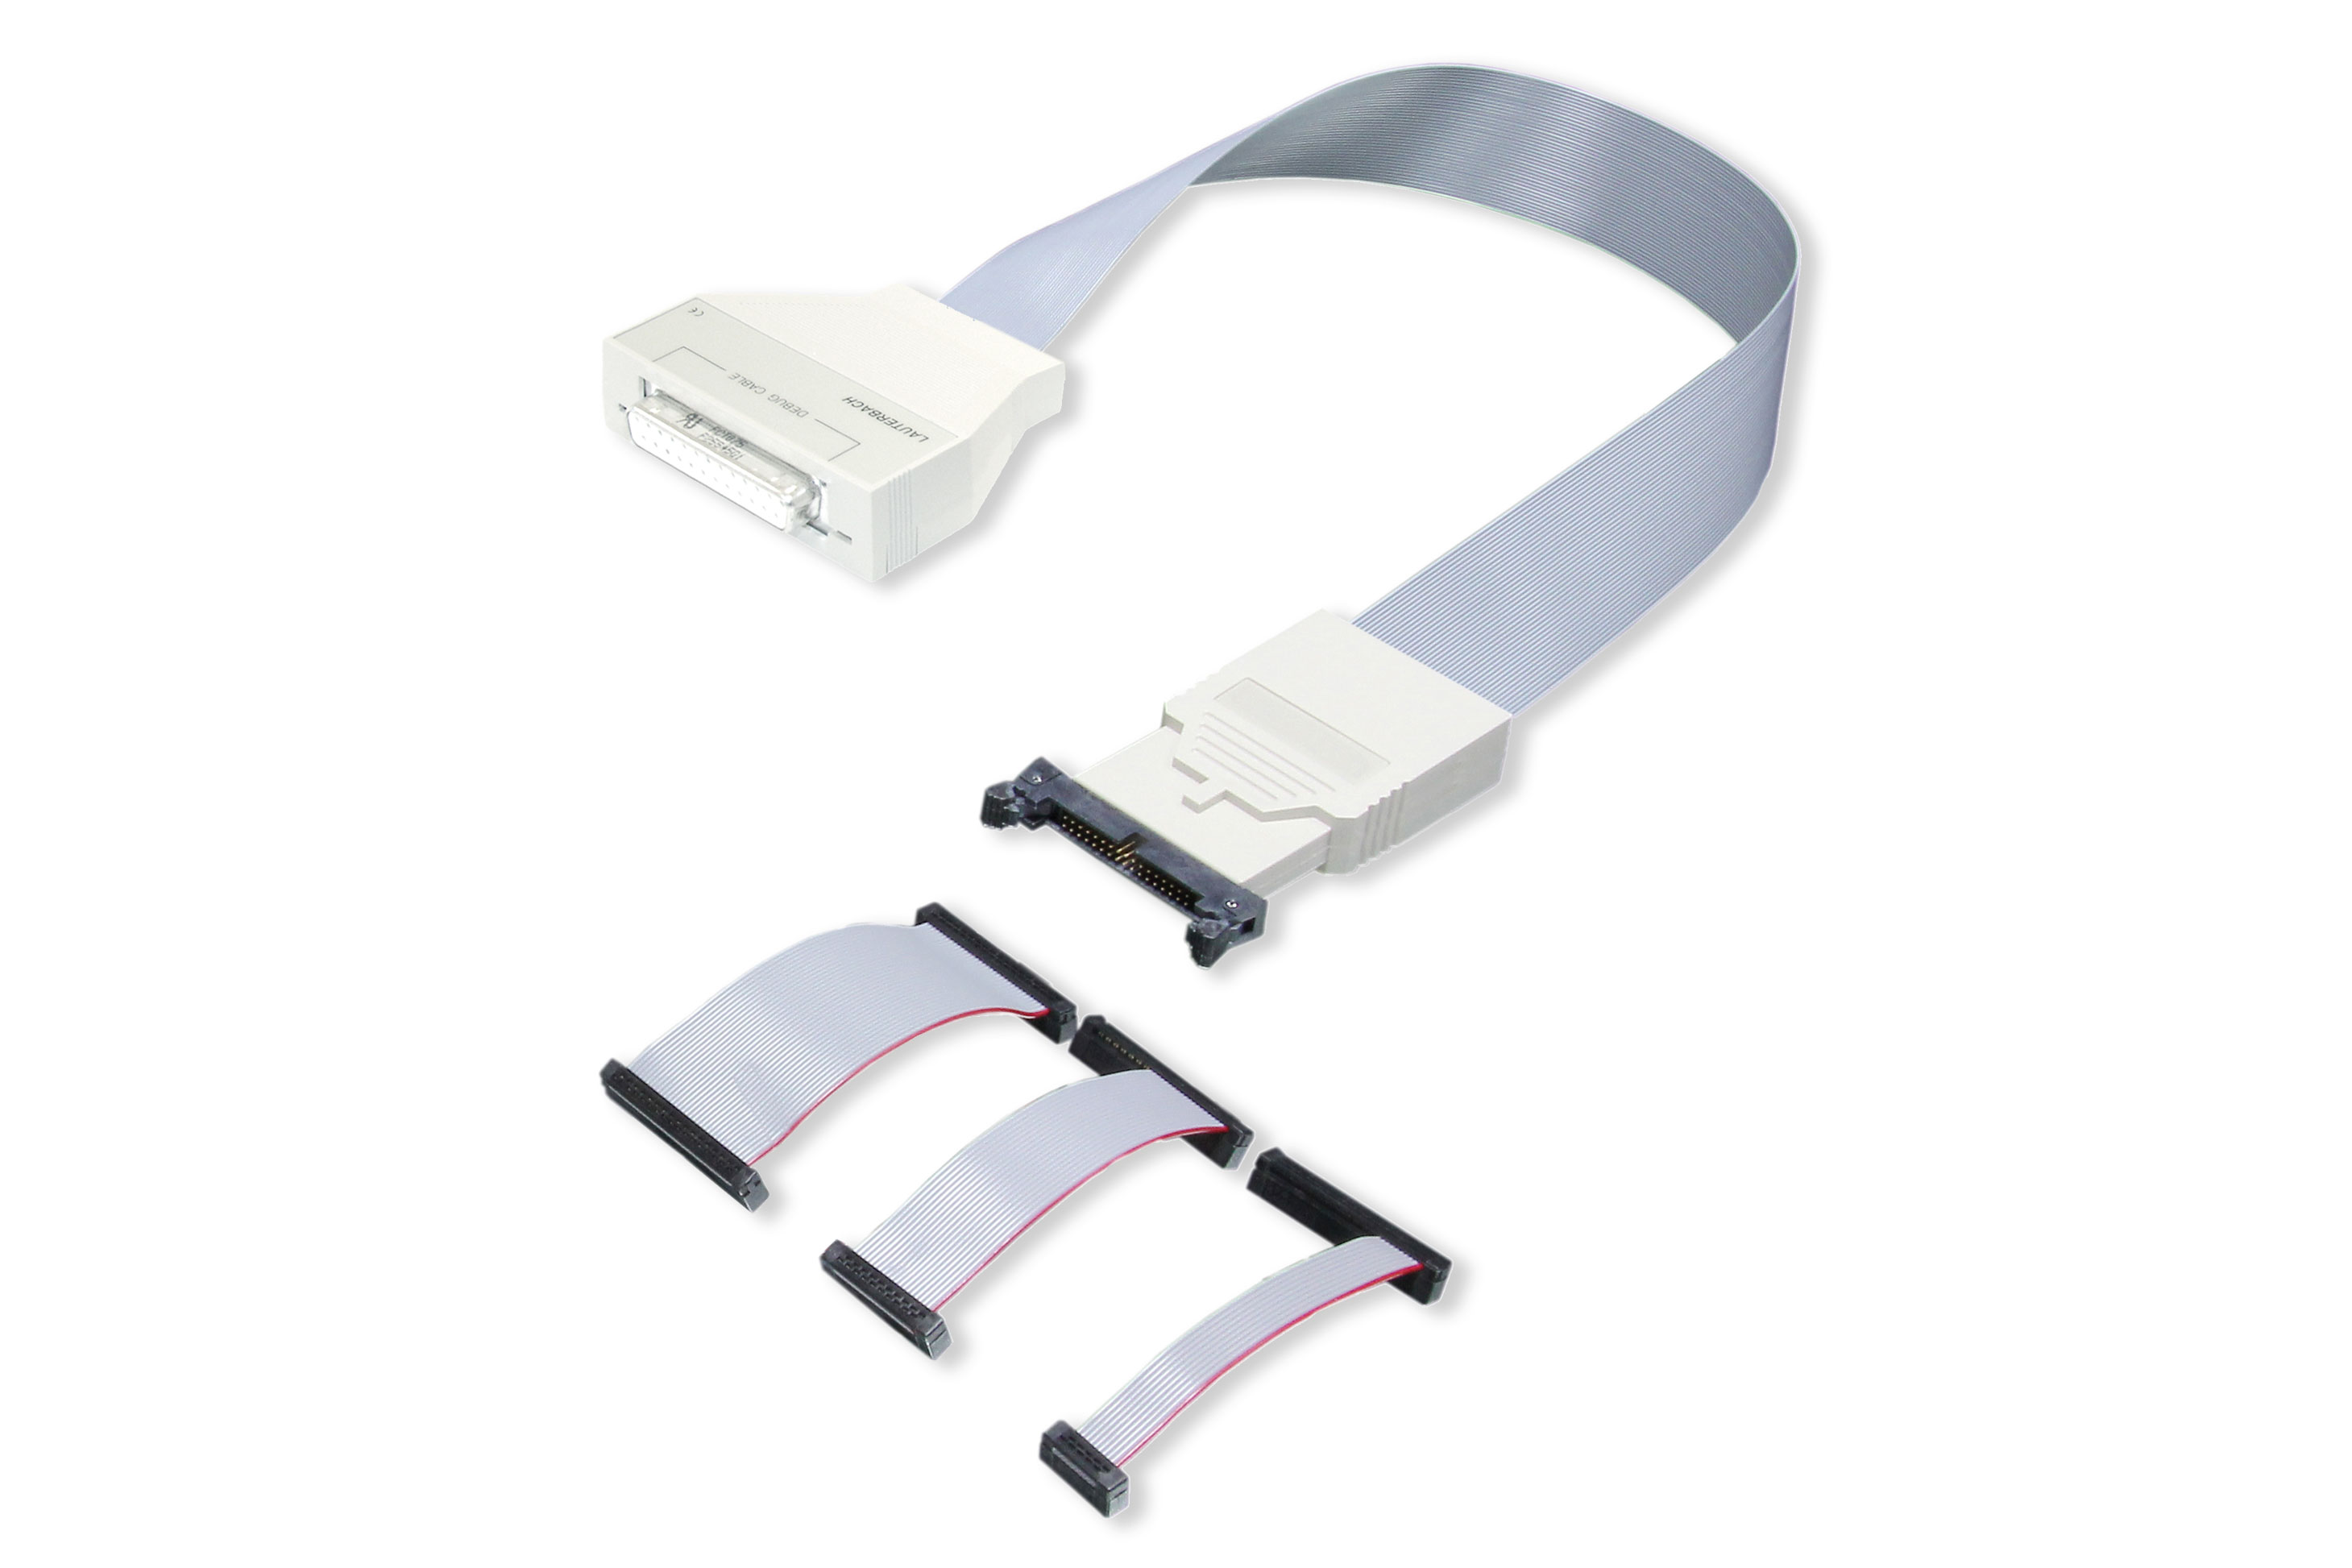
IDC20A Debug Probe
Engineered for Ultimate Flexibility with Industry-Standard Pinout Designed to offer maximum adaptability, this solution features one of the most widely used pin configurations in the embedded market, ensuring seamless compatibility across a broad range of devices and platforms.
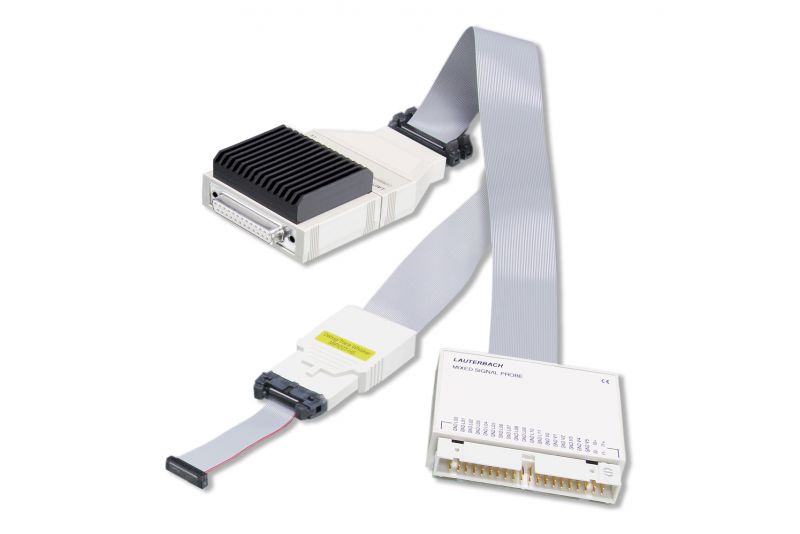
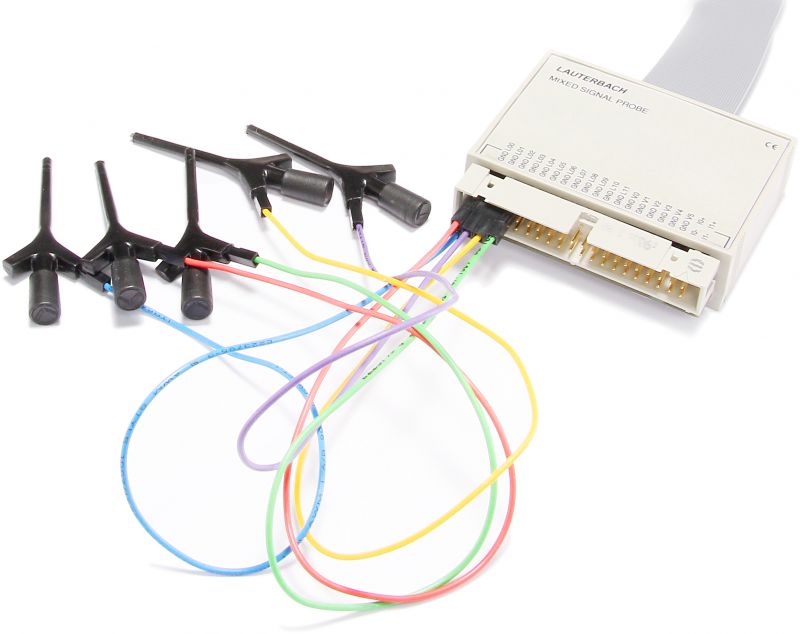
CombiProbe
Compact Debug and Trace System with Up to 4-Bit Wide Trace Ports
Architecture-specific Debug Probes
Specialized debug probes dedicated to specific target platforms.
SUPPORTED DEBUG PROTOCOLS
Whatever protocol your target uses, TRACE32 speaks its language
CoreSight Serial Wire Debug (SWD)
SWD is a 2-pin debug interface developed by Arm®, designed for high-efficiency access to the CoreSight™ debug infrastructure. It offers maximum performance with minimal pin usage, making it ideal for compact embedded systems.
cJTAG (IEEE 1149.7)
Compact JTAG (cJTAG) is a streamlined version of the standard JTAG protocol that reduces the number of required physical pins by serializing communication with the core’s Test Access Points (TAPs). It supports a star topology for connecting multiple chips and helps lower hardware costs, with only a minor trade-off in debug performance.
JTAG (IEEE 1149.1)
JTAG is the standard communication protocol supported by most CPUs. Originally developed for boundary scan testing, it enables external tools to interface with a chip's internal debug system through a Test Access Point (TAP). Multiple TAPs can be connected in a chain, allowing you to debug several cores using a single probe.
Renesas LPD and UART Debug Modes
Renesas Low Pin Debug (LPD) is a proprietary debugging protocol available in two variants: LPD4 (4-pin) and LPD1 (1-pin). The LPD4 mode additionally supports low bandwidth and software trace features (SFT). For serial flash programming, Renesas protocols also accommodate asynchronous and synchronous interface modes, including UART and CSI.
Background Debug Mode (BDM) – Serial On-Chip Debugging Protocol
Background Debug Mode (BDM) is a serial shift register protocol designed for on-chip debugging. Originally developed by Motorola/Freescale, BDM is widely used in NXP’s ColdFire, M68K, MPC55x, and PowerQuicc device families. A variant known as Single-Wire BDM is specifically employed with S12, S12X, and S12Z microcontrollers.
Nexus (IEEE 5001) – Standardized Debug and Trace Interface
The Nexus standard (IEEE 5001) defines a widely adopted protocol for debugging and tracing embedded processors. Most modern Nexus-compliant devices utilize standard JTAG interfaces for debugging, while an additional auxiliary port handles real-time trace data transmission. Some processors, such as the MPC56x and MP63x series, employ a parallel auxiliary port operating in full-duplex mode to support both debugging and tracing simultaneously.
SPITFIRE™ – Serial Debug Protocol for Microchip dsPIC® Processors
SPITFIRE™ is a two-wire serial debugging protocol based on SPI, specifically designed for Microchip dsPIC® processors. The AUTO26 debug probe also supports the ICSP protocol, enabling in-circuit programming of dsPIC® flash memory for seamless development and testing.
Spy-Bi-Wire – Serialized JTAG Protocol by Texas Instruments
Spy-Bi-Wire is a serialized JTAG protocol, similar to cJTAG, developed by Texas Instruments. It is supported on select MSP430 microcontrollers alongside standard JTAG. By using Spy-Bi-Wire, the number of physical pins required for debugging is reduced to just two, freeing up additional pins for other functions.
Andes Serial Debug Port
The Serial Debug Port is a streamlined two-wire debugging interface developed by Andes Technology for AndesCore™ and RISC-V processors, offering efficient and straightforward debug capabilities.
eJTAG – Enhanced Debug Interface for MIPS Processors
eJTAG extends the IEEE 1149.1 JTAG standard by offering a customized debug interface specifically designed for MIPS-based processors and System-on-Chip (SoC) architectures, enabling advanced debugging capabilities.
Renesas Single-Wire UART Debug Interface
RL78 microcontrollers utilize a UART-like single-wire debug interface that operates via the RESET and TOOL0 pins. In contrast, the older 78K0R processors require an additional signal line, TOOL1, to support debugging functions.
UPDI – Unified Program and Debug Interface by Microchip
The Unified Program and Debug Interface (UPDI) is a proprietary protocol developed by Microchip for programming and debugging tinyAVR® and megaAVR® microcontrollers. UPDI operates over a single pin, which also serves as the chip’s reset line, simplifying hardware design. Additionally, these devices support programming via Serial Peripheral Interface (SPI).
Innovating with New and Emerging Debug Technologies
TRACE32 leads the way in advanced debugging solutions, with Lauterbach engineers actively participating in industry working groups and steering committees focused on embedded systems. The platform continuously integrates cutting-edge interfaces such as SPI debugging, DCI-OOB, USB-based debug, CAN-based debug, and other emerging technologies to meet evolving development needs.
EXTENSIONS
Power Up Your Debugger
A wide selection of add-on modules is available to enhance and expand your debug system’s capabilities, providing the flexibility and adaptability needed to meet the demands of any embedded development project.
Trace Extensions
Many modern embedded processors offer trace options that provide real-time, non-intrusive insights into program flow, data tracing, device resource monitoring, or even all of these simultaneously. Integrating a trace tool into your setup enriches your TRACE32 environment with advanced analysis features such as detailed runtime inspection, code and data coverage, and task switch analysis.
TRACE32 supports a wide array of trace ports and protocols through interchangeable pre-processors and various buffer modules, ensuring your trace system is as flexible and scalable as your debug setup. All trace functions are accessible through the same intuitive user interface, reducing training time and maximizing your return on investment. With TRACE32, your embedded debugging and tracing solution is built to support your projects over the long term.
Logic Analysis Extensions for Comprehensive Signal Monitoring
Enhance your debugging setup by adding a logic analyzer module, enabling precise sampling of digital and analog signals from your embedded system. Easily cross-trigger between software events—such as breakpoints—and real-world signal activity. By capturing analog signals alongside program flow, you can correlate application performance with power consumption.
TRACE32 includes built-in protocol analyzers for popular interfaces like CAN, USB, I2C, and memory buses, and offers seamless extensibility to support custom protocol analysis tailored to your specific needs.
Galvanic Isolation for Safe High-Voltage Debugging
Protect your debugging tools and PC with galvanic isolation, which electrically separates your high-voltage target signals from your equipment. This safety feature ensures secure, damage-free debugging when working with high-voltage embedded systems.