OVERVIEW
Visualize Your Embedded System Like Never Before
What if you could monitor every step your embedded system takes—without affecting its real-time behavior? With trace-based debugging, this becomes a reality. You gain full visibility into code execution, system performance, and code coverage, which is essential for validating safety-critical applications. The result? Faster time-to-market, improved product stability, and greater confidence in your system’s reliability.
Using advanced PowerTrace modules, detailed runtime information is captured while your embedded target continues to operate as usual—no slowdowns, no interference. The data is then streamed and visualized in real-time through the intuitive TRACE32 PowerView interface, offering the same scriptable flexibility and control developers rely on for traditional debugging workflows.

About Trace
Why You Need Real-Time Trace for Embedded Development
Debugging an embedded system without tracing is like trying to understand a race by glancing at a few photos—you miss the full picture. In contrast, real-time tracing gives you continuous insights, similar to accessing a race car’s full telemetry: you know exactly what happened, when, and why.
With the PowerTrace hardware extensions, you gain access to precise program flow information, showing which instructions were executed and how much time each one took. This detailed runtime data lets you:
Identify elusive bugs that only appear during full-speed execution
Detect timing bottlenecks that slow down your system
Verify that your application meets strict real-time constraints
Generate accurate code coverage metrics for functional safety standards
Many modern embedded CPUs already support this type of non-intrusive trace output. All it takes is the right toolchain to capture and interpret the data effectively—like the PowerTrace modules integrated with the TRACE32 environment.
BENEFITS
Powerful Features Backed by 40+ Years of Innovation
With more than four decades of expertise in embedded trace and debug technologies, Lauterbach delivers tools that evolve alongside the industry’s needs. Thanks to ongoing development and deep collaboration with leading technology partners, TRACE32® solutions are built to support a wide range of embedded systems—whatever your challenge may be.
Full-System Visibility Across All Layers
Monitor every part of your embedded system in parallel—whether it’s the hypervisor, guest operating systems, device drivers, ISRs, middleware, or application code. TRACE32 gives you synchronized insight into software activity across all cores, from low-level services to high-level applications.
Never Miss a Moment
Capture rare, hard-to-reproduce events and understand exactly what caused them. TRACE32 enables ultra long-term data recording—spanning hours, days, or even weeks—by streaming trace data directly to your local PC, ensuring virtually unlimited trace depth.
High-Speed Trace Recording Without Compromise
Capture every detail with trace buffer sizes up to 8 GB and bandwidths reaching 100 Gbit/s. PowerTrace delivers industry-leading performance and supports a wide range of modern trace protocols, ensuring reliable data capture even in the most demanding embedded systems.
Multi-Core Trace for Any Architecture
Capture trace data from multiple cores simultaneously—whether they use the same architecture or a combination of heterogeneous processors. TRACE32 enables synchronized multi-core tracing through a single trace port and a unified toolchain.
💡Did you know…
On-Chip and Off-Chip Trace—Fully Supported
TRACE32 supports both on-chip and off-chip trace methods, giving you flexibility based on your system’s needs. On-chip trace stores data in small, high-speed memory buffers integrated into the processor—ideal for short trace windows. Off-chip trace uses external interfaces to stream data into large external buffers, typically several gigabytes, enabling extended trace sessions and deeper analysis. With TRACE32, you can seamlessly work with both approaches.
COMPONENTS
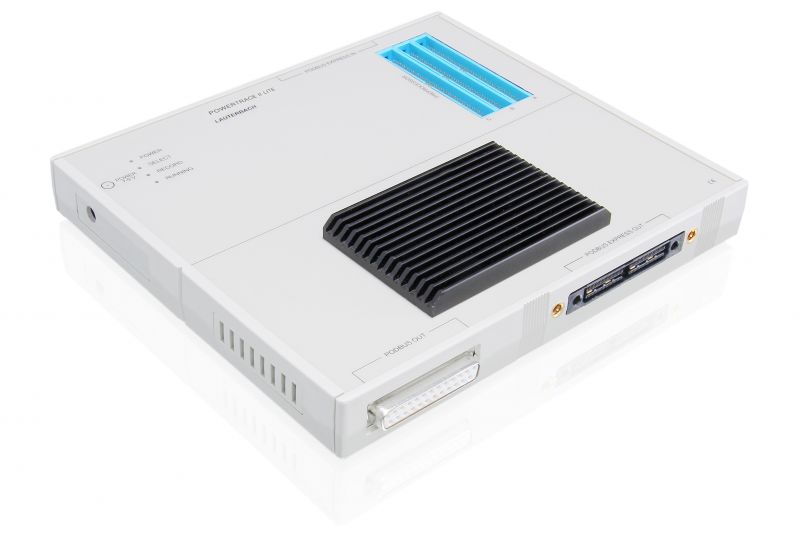
Upgrade Your PowerDebug X51 with a PowerTrace Extension
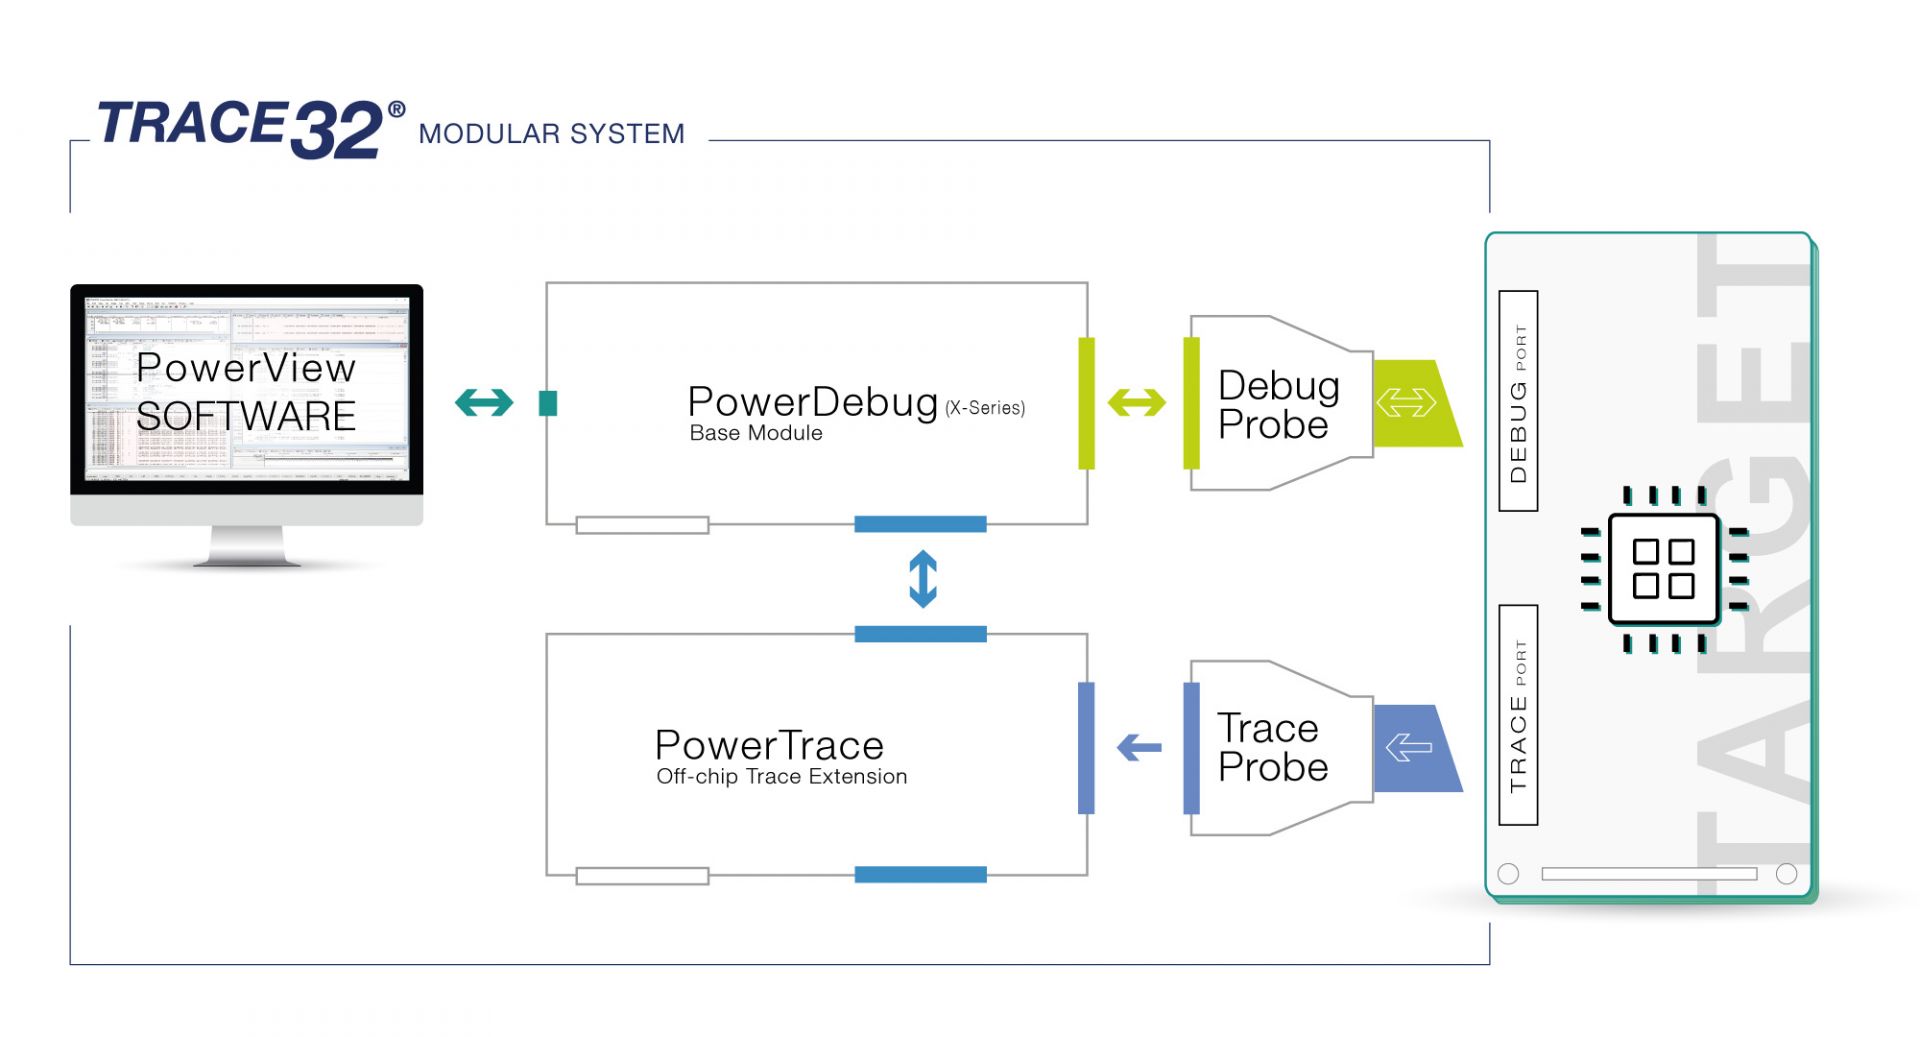
Enhance your TRACE32 setup by adding a PowerTrace to your PowerDebug X51. As part of Lauterbach’s modular PowerDebug system, PowerTrace modules attach directly to the side of your X51 and connect to your development PC via USB 3.0 or Gigabit Ethernet. Even legacy units like PowerDebug PRO and PowerDebug II can benefit from this powerful extension.
To link PowerTrace to your target system’s trace port, a platform-specific connector is required—just like with a standard debug probe. Depending on the setup, this may be a dedicated trace probe (also known as a trace preprocessor), a flex cable, or a passive adapter—especially when using PowerTrace Serial.
If your target hardware features a unified connector for both debug and trace, you can route the debug signals through the trace interface by connecting your debug probe to the Lauterbach trace hardware—ensuring seamless integration and minimal complexity.
TRACE EXTENSIONS
Select the Ideal PowerTrace Extension for Your SoC
The choice of PowerTrace module depends on your chip’s trace transfer technology—whether parallel or serial trace. Both module types are engineered to meet the highest performance demands, supporting current and future data throughput requirements. Lauterbach offers cutting-edge, versatile tools compatible with nearly all trace transfer methods and embedded device data formats.
For lower-speed processors, including Arm Cortex-M cores, we provide two compact and affordable options: the CombiProbe and µTrace modules, delivering efficient debug and trace capabilities without compromise.
Download Lauterbach Trace Solution Overview
Find all relevant figures in this document, to guide you fast and accurate to a Trace solution which fits perfectly to your requirements.
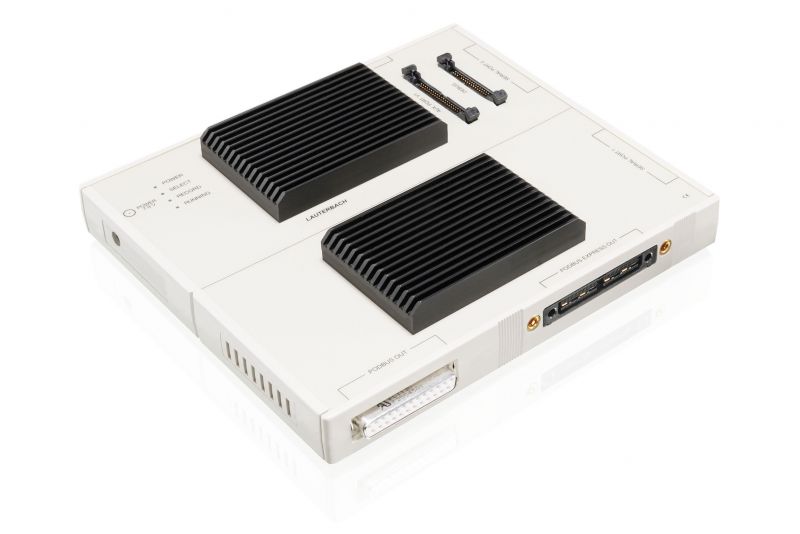
PowerTrace Serial 2
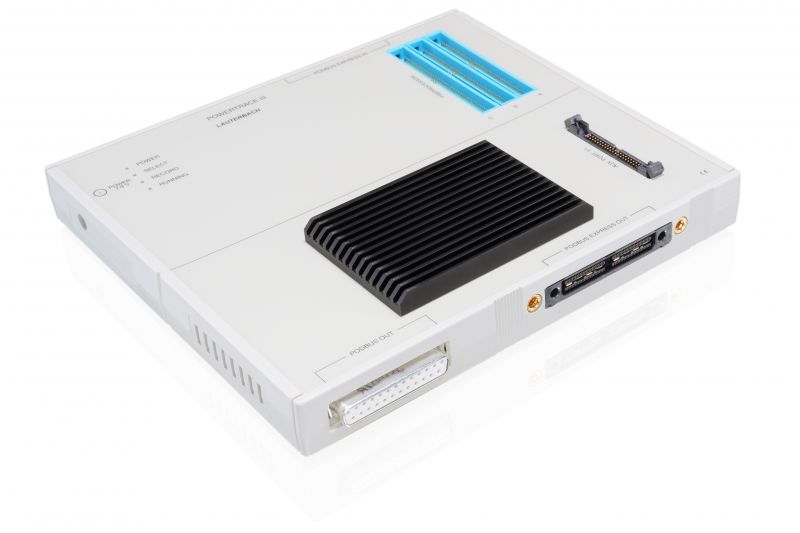
PowerTrace III