Home » StackAnalyzer
In safety-critical embedded systems, stack overflows can be catastrophic. Unlike dynamic memory, stack memory must be statically allocated by the programmer—and errors in estimating stack size can lead either to wasted memory or dangerous runtime failures. StackAnalyzer from AbsInt is a powerful static analysis tool designed to solve this problem by automatically determining the worst-case stack usage for each task in your application.
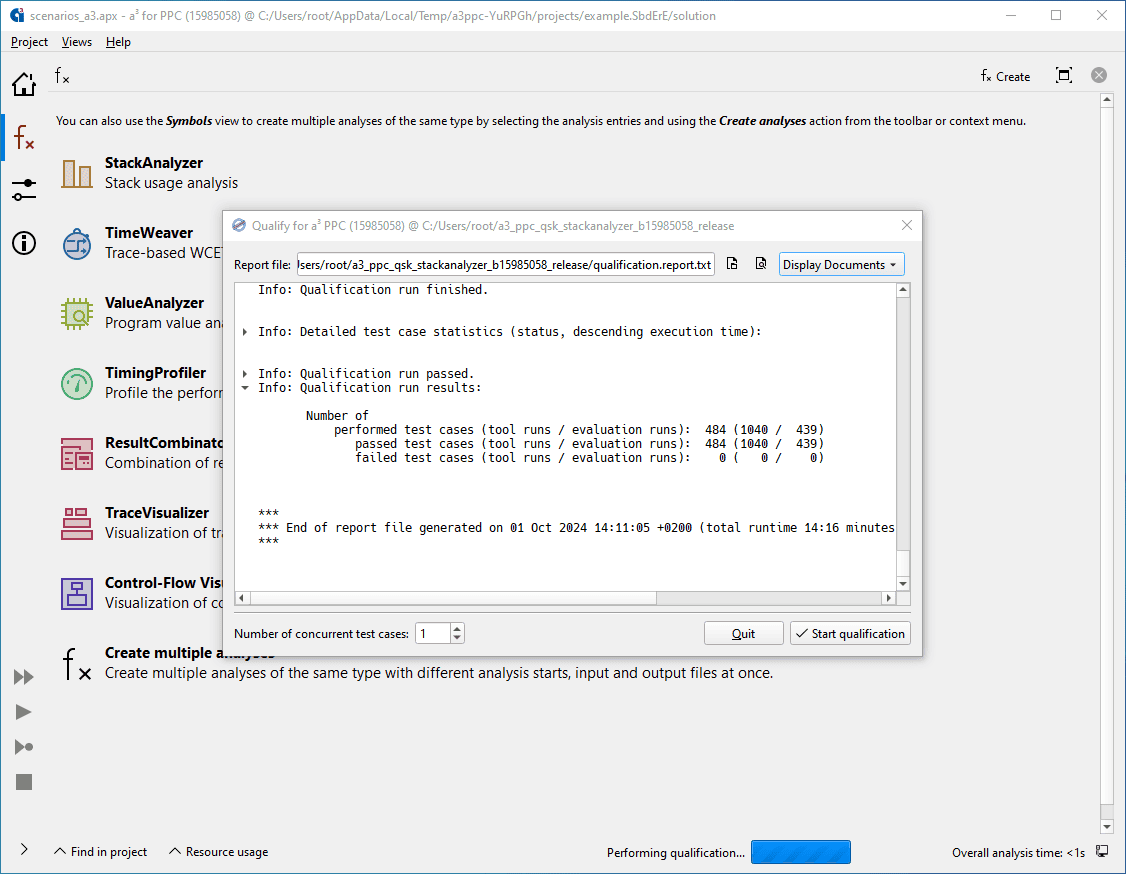
With support for a wide range of processors and compilers, and qualification kits available for safety certification standards, StackAnalyzer is the go-to solution for developers working on real-time systems with stringent reliability requirements.
Stack memory is used to store function call information, local variables, and return addresses. In embedded applications—especially those running on microcontrollers with limited memory—stack space must be carefully allocated at compile time.
Underestimating stack usage may cause stack overflows, potentially overwriting data or causing unpredictable behavior and system crashes. On the other hand, overestimating stack usage wastes valuable memory, reducing the efficiency of the system.
Unlike other forms of runtime error, stack overflows often occur only under very specific execution paths or rare conditions, making them difficult to catch through testing alone. Moreover, modern software architectures, with recursion, indirect function calls, or dynamically-loaded modules, make it even harder to predict maximum stack usage manually.
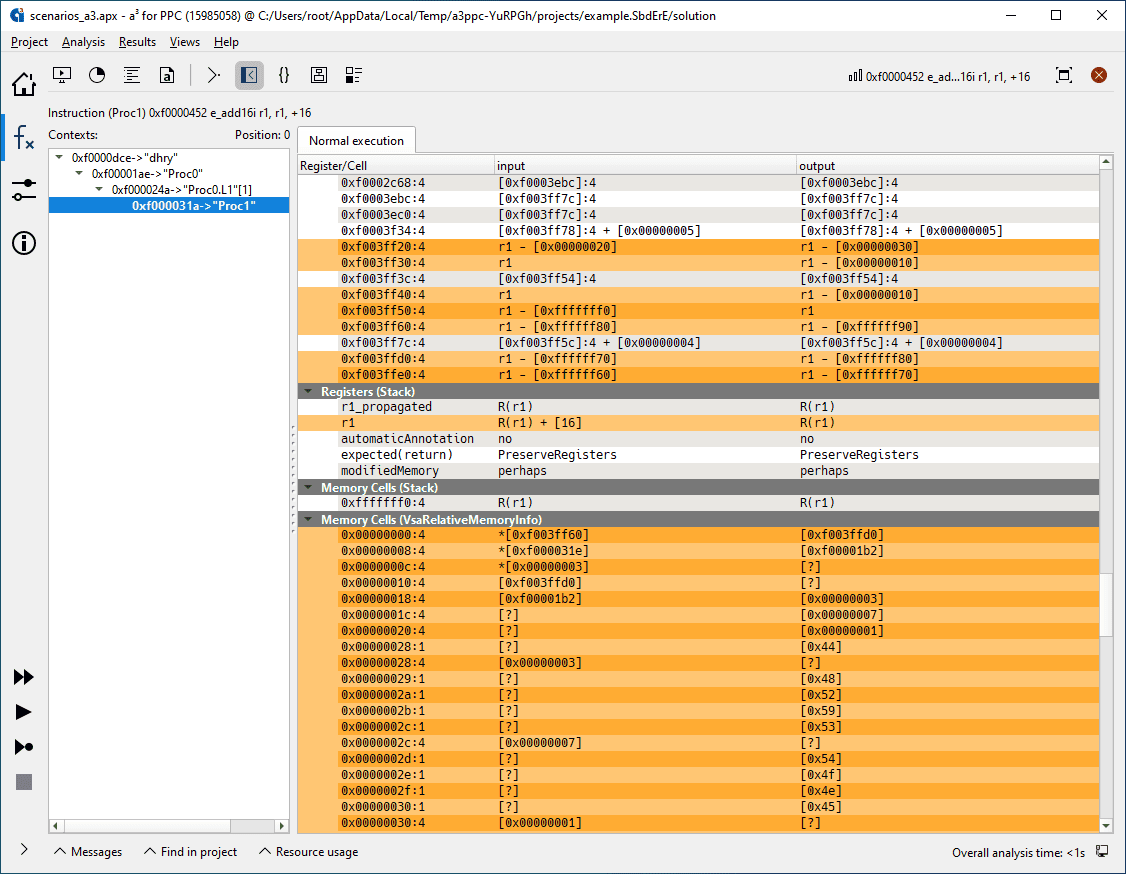
StackAnalyzer provides an automated and sound method for determining the maximum stack depth of each task or thread in an application. Unlike tools that rely on testing or debugging information, StackAnalyzer performs binary-level analysis directly on the executable, ensuring accurate and consistent results regardless of the compiler or build configuration.
Key advantages:
Using StackAnalyzer is straightforward and fits naturally into your development workflow. You provide the final executable (e.g., .elf, .out), and the tool performs a full static analysis of the program’s control flow and stack usage.
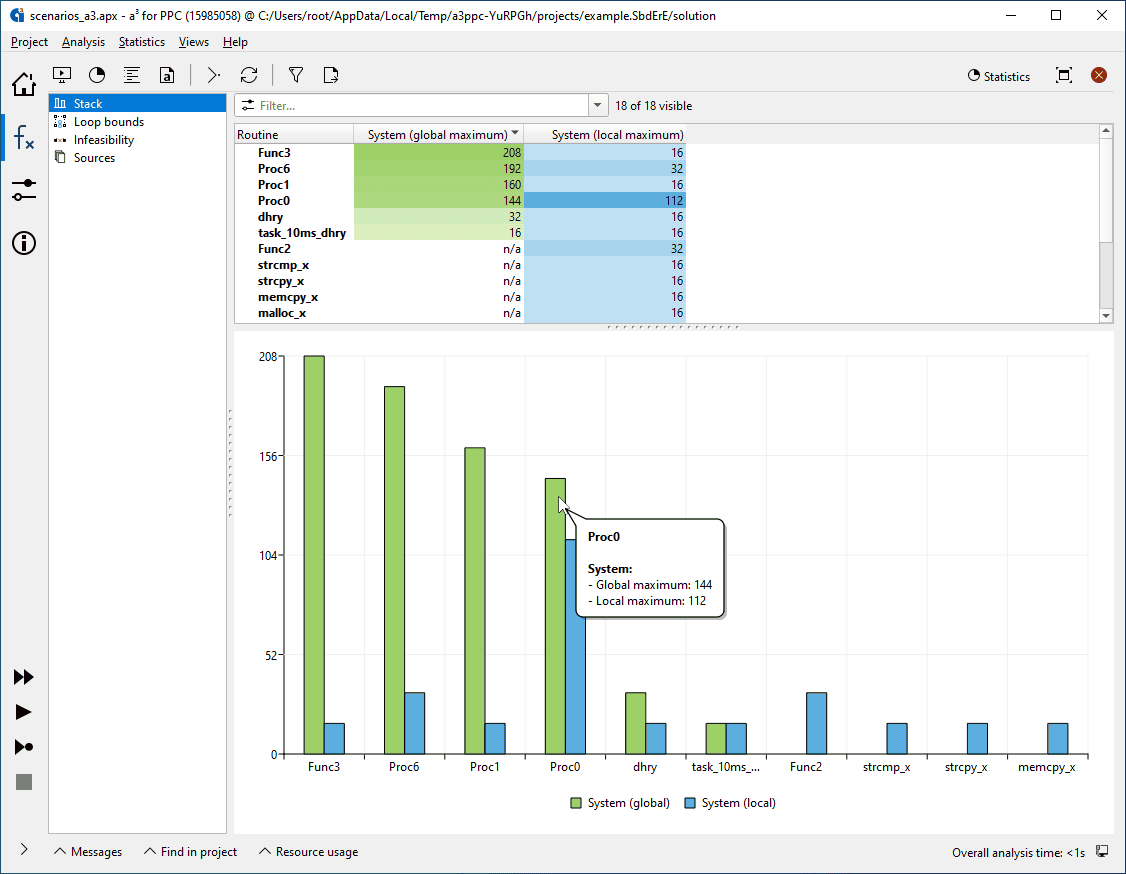
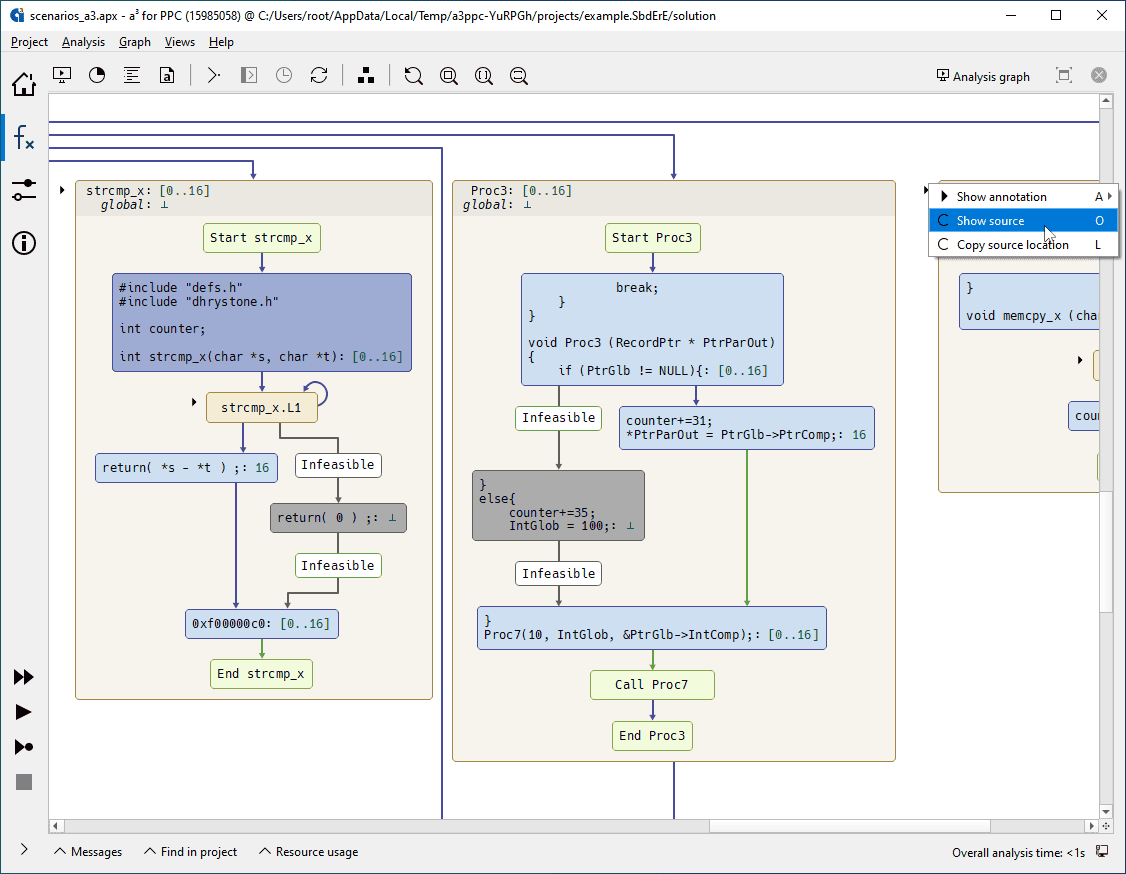
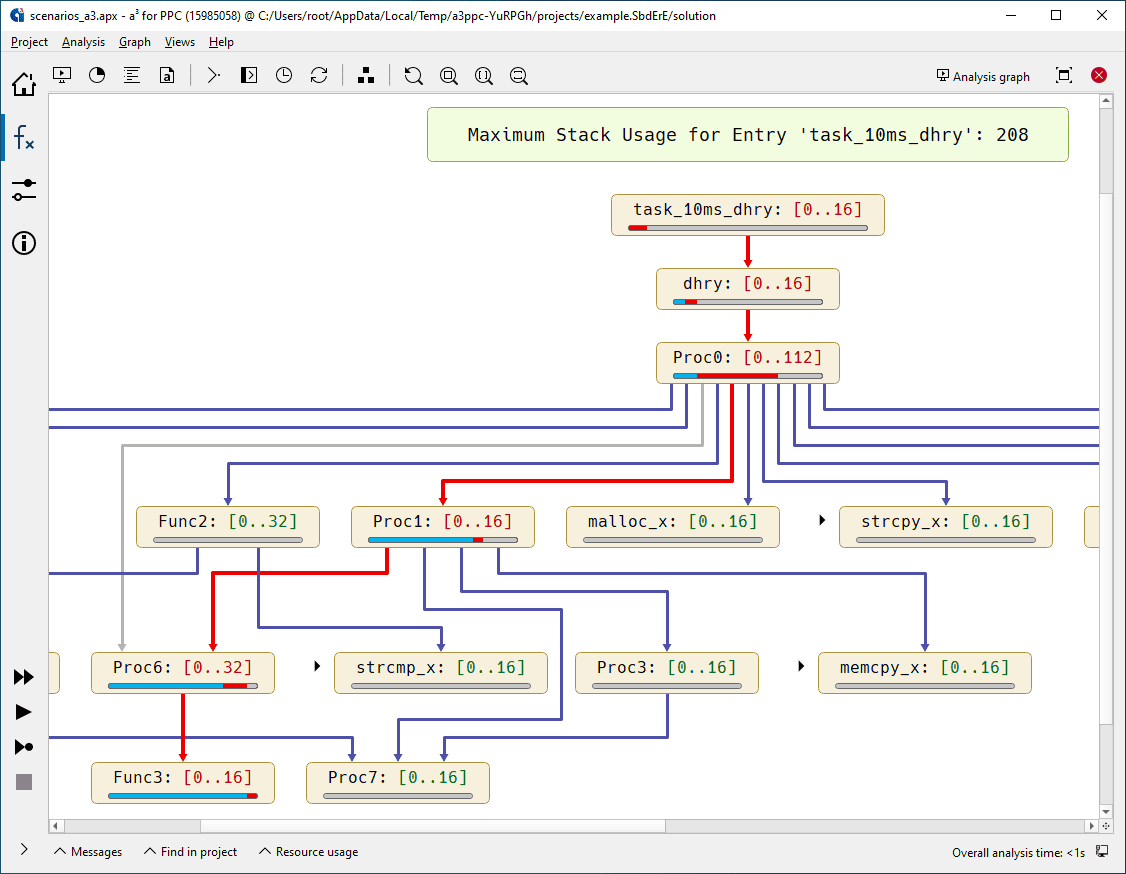
Developers can annotate their code to specify additional constraints, such as loop bounds or recursion depth, allowing for even tighter and more accurate analysis. The graphical interface provides intuitive navigation of the call graph, showing the critical paths and peak stack usage per function, enabling developers to focus optimization efforts where they matter most.
For larger applications with multiple threads or tasks, StackAnalyzer can analyze each entry point separately, making it suitable for multi-threaded RTOS-based systems.
StackAnalyzer supports an extensive variety of processors and compilers, including:
If your target processor is not listed, AbsInt offers support and consultation for adding new architectures upon request.
StackAnalyzer is indispensable for:
With StackAnalyzer, developers can prove the absence of stack overflows—not just assume it. This level of assurance is essential in fields where software reliability is directly tied to human safety, such as avionics, automotive systems, industrial automation, medical devices, and space systems.
StackAnalyzer by AbsInt eliminates one of the most insidious risks in embedded development: the stack overflow. By automating worst-case stack analysis and ensuring comprehensive coverage of all execution paths, StackAnalyzer helps development teams deliver safer, more efficient, and more certifiable software.
Whether you’re working on a lightweight embedded control system or a complex, multi-threaded RTOS application, StackAnalyzer provides the precision, performance, and safety integration you need—so that memory issues remain a problem of the past.
WhatsApp us